

And They’re Off!
In less than a month, the oldest continually performed American sporting event will take place at Churchill Downs in Louisville, Kentucky. The Kentucky Derby will see a field of about twenty or so, three-year old thoroughbreds load into the starting gates for their run at racing legend. Last year, wagering from all-sources was the highest all-time on both the Kentucky Derby Day program and on the Kentucky Derby race. Wagering from all sources on the entire program totaled $194.3 million while wagering from all sources on the Kentucky Derby race alone totaled $137.9 million. Churchill Downs returned $154.3 million to bettors on the Kentucky Derby Day race program plus purses of $10.7 million that was paid out to horsemen during the remainder of the 2015 race meets.
Despite the high dollar figures produced by markets on major race days, the real money is in the breeding, not the racing of horses. The horse business is a $39 billion dollar industry driven by the thoroughbred. These horses are prized for their pedigrees.
Keeneland Association Inc. in Lexington, Kentucky is best known for its race track. They recently provided the setting for the richest two days in American racing, when they hosted the 2015 Breeders Cup last November. Keeneland is also home to the most important thoroughbred horse auction house worldwide. This is where values are set on thoroughbreds throughout the world. Horses are bought for hundreds of thousands or sometimes even millions each. The Keeneland Yearling Sales feature over four thousand yearlings, none of which have ever been saddled. Formal competition does not begin for these horses until they are at least two years of age.
Without any help from past performance records or speed figures, prospective bidders at the Keeneland sales study bloodlines and speculate as to whether the biological characteristics of a horse deserve a market order. A black-type pedigree and progeny is what buyers want. Black-type is the font applied to stakes winning members of a yearling’s family tree. A stakes race is the highest class of race and the desired level of competition that most buyers at the Keeneland sales would like to see in a thoroughbred’s family. Depending on how the black-type is positioned in the family tree, more black-type means a higher price tag at the Keeneland sales.
These criteria lead to speculation at best considering only 50% of thoroughbreds ever win a race and less than 1% will win a stakes race. Imagine sitting at a playground with four thousand children and picking one of them with $1 million of your hard earned dollars to be the next Tiger Woods or Serena Williams.
The highest price ever paid for a thoroughbred at auction was $16 million in 2006 for a bay colt named The Green Monkey. As a descendant of both Northern Dancer and the great Secretariat, big things were expected. On the race track, The Green Monkey was a complete failure. He ran three races before being retired and never finished better than third. His career earnings totaled $10,440. The Green Monkey’s progeny have not performed any better and currently he stands at stud in Florida for a fee of only $5,000.
Over the same time period of January 2006 to present, SPDR S&P 500 ETF (SPY) increased 60%.
This level of speculation and opportunity cost could not continue to exist if not for the small probability of extreme upside. A thoroughbred named Tapit was bred and raced by his owner, Winchell Thoroughbreds LLC. He ran six times in his career, achieving 3 wins including the Grade 3 Laurel Futurity Stakes and the Grade 1 Wood Memorial Stakes. Tapit made it to the starting gate of the 2004 Kentucky Derby and was sent off as the 5-1 second choice. He finished ninth.
During his race career Tapit earned $557,300, but in the breeding shed Tapit has become the definition of a stud. In his lifetime at stud, Tapit has produced 73 black-type winners, 159 black-type horses 17 Grade 1 stakes winners, 45 graded stakes winners, 11 millionaires, six champions and 5 Breeders’ Cup winners. He has been the leading American sire the last two years. Because of his success, the market has set his stud fee at $300,000. He was bred to 134 mares in 2015 alone.
The probability of a thoroughbred making it to the starting gate for The Kentucky Derby is extremely low, but that is the dream. The possibility of joining “The Run for the Roses” is why such risk is assumed and large sums of money are paid out for such speculative operations. The current points system in place to join the Kentucky Derby field pretty much guarantees that a horse that makes it to the starting gate has earned black-type which will make him more valuable at stud, at least initially.
Fusaichi Pegasus made it to the starting gate and won the Kentucky Derby in 2000. He ended his racing career with six wins from nine starts and earned nearly $2 million. After being retired Fusaichi Pegasus became the most sought after horse for breeding. He was bought by Coolmore Stud, the world’s largest thoroughbred breeding operation for an estimated $70 million. Initially his stud fee was set at $150,000. He proved to be a disappointment as a stud horse. He now resides in Kentucky with a stud fee of only $7,000.
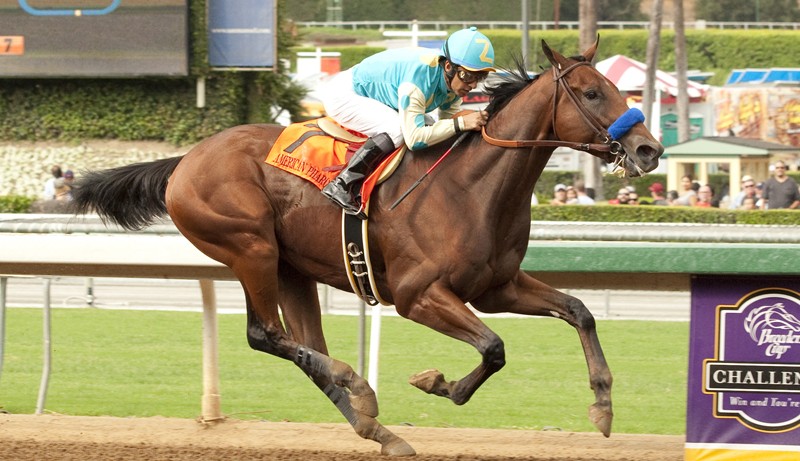
Race fans and horsemen alike waited thirty-seven years for American Pharoah to win the Triple Crown. Since then American Pharoah has been retired and will begin his stud career with a fee of $200,000. It will be at least two years until anyone can determine whether or not that price is justified.
In less than a month, a field of twenty or so three-year old physical embodiments of pure speculation will break from their gates at Churchill Downs in the 142nd running of the Kentucky Derby. There is expected to be 160,000 plus in attendance and another 20 million watching at home for horse racing’s next legend. Horse breeders and owners will also be watching and aware that despite the performances on May 7th the best, or worst is yet to come.
Pingback: dofollow backlink with wiki link()
Pingback: sex()
Pingback: Best Newspaper in India()
Pingback: Best Newspaper in India()
Pingback: information security architect()
Pingback: Entertainment and Movie reviews with tips on how to get Website Traffic and Make Money Online.()
Pingback: ankara escort()
Pingback: para para dinle()
Pingback: joseph de saram()
Pingback: perjuriousperverts()
Pingback: Trisha()
Pingback: joseph de saram()
Pingback: joseph shihara rukshan de saram()
Pingback: rhodium()
Pingback: sfeerhaard()
Pingback: anabolic steroids for muscle building()
Pingback: professional dryer vent cleaning()
Pingback: Sandra balan()
Pingback: computer reparatie Aalten()
Pingback: gay parenting()
Pingback: m88 vn bet()
Pingback: Visit Your URL()
Pingback: tøj til hverdag og fest()
Pingback: erotik outlet()
Pingback: kimsin sen()
Pingback: une bite()
Pingback: steroids libido()
Pingback: http://britlock.com.au()
Pingback: click here to find an attorney()
Pingback: testodex cypionate online()
Pingback: m88asia()
Pingback: celtic gold rings()
Pingback: removals to ireland from London()
Pingback: distribuidora de papas()
Pingback: Wedding Photographer Sligo()
Pingback: chimney()
Pingback: download free()
Pingback: apps()
Pingback: VeFast USA()
Pingback: kid fights teacher()
Pingback: http://chukysogiare.org()
Pingback: bestangrybirdgames.com/download-angry-birds/()
Pingback: financial fraud()
Pingback: Your Marketplace for Bitcoin shopping()
Pingback: Bilskrot Göteborg()
Pingback: Skrota bilen Göteborg()
Pingback: weightlifting steroids for sale()
Pingback: mobic meloxicam medication()
Pingback: Cialis vs viagra()
Pingback: Viagra tablets()
Pingback: Online cialis()
Pingback: Generic for viagra()
Pingback: Cialis 20 mg()
Pingback: Cialis 5mg prix()
Pingback: Generic viagra()
Pingback: Viagra vs cialis()
Pingback: Generic cialis()
Pingback: Buy cialis()
Pingback: writeaessay()
Pingback: Cialis 5 mg()
Pingback: Buy cialis()
Pingback: Cialis online()
Pingback: buy cialis 20mg()
Pingback: buy levitra()
Pingback: freshamateurs953 abdu23na644 abdu23na87()
Pingback: cialis sale()
Pingback: cheap cialis 20mg()
Pingback: cialis for daily use()
Pingback: generic cialis without a doctor()
Pingback: generic viagra online()
Pingback: buy viagra 100 mg()
Pingback: female viagra online mail-order pharmacies()
Pingback: viagra prices()
Pingback: cheap viagra 50mg()
Pingback: viagra professional online mail-order pharmacies()
Pingback: viagra 50mg()
Pingback: cheap 100 mg viagra()
Pingback: sildenafil prices()
Pingback: cheap generic viagra()
Pingback: tesco viagra()
Pingback: buy sildenafil online()
Pingback: viagra super force online mail-order pharmacies()
Pingback: cheap viagra()
Pingback: cheap 50 mg viagra()
Pingback: viagra for men()
Pingback: viagra()
Pingback: viagra plus online mail-order pharmacies()
Pingback: viagra for women()
Pingback: buy viagra 50 mg()
Pingback: sildenafil buy()
Pingback: viagra pills()
Pingback: female viagra pills()
Pingback: women viagra()
Pingback: pink viagra online mail-order pharmacies()
Pingback: viagra 100 mg()
Pingback: viagra buy()
Pingback: where to buy viagra()
Pingback: viagra 50 mg()
Pingback: pfizer viagra()
Pingback: cheap viagra 100 mg()
Pingback: buy 50 mg viagra()
Pingback: viagra oral jelly online mail-order pharmacies()
Pingback: buy viagra()
Pingback: cheap viagra generic()
Pingback: buy viagra generic()
Pingback: generic for viagra()
Pingback: viagra cost()
Pingback: viagra online()
Pingback: viagra generic availability()
Pingback: order viagra online()
Pingback: viagra online paypal uk()
Pingback: womens viagra()
Pingback: viagra generic()
Pingback: sildenafil coupon()
Pingback: viagra canada()
Pingback: online viagra()
Pingback: sildenafil citrate()
Pingback: cheap sildenafil online()
Pingback: sildenafil online()
Pingback: cheap viagra 50 mg()
Pingback: 100 mg viagra()
Pingback: viagra for sale()
Pingback: 100 mg viagra lowest price()
Pingback: generic viagra prices()
Pingback: viagra capsules online mail-order pharmacies()
Pingback: viagra coupon()
Pingback: viagra soft tabs online mail-order pharmacies()
Pingback: levitra rezeptfrei deutschland()
Pingback: buy 20mg levitra()
Pingback: buy generic levitra()
Pingback: buy 10mg levitra()
Pingback: levitra 20 mg bayer prezzo()
Pingback: levitra 10 mg prezzo()
Pingback: vardenafil prices()
Pingback: vardenafil cost()
Pingback: cheap vardenafil online()
Pingback: levitra cost()
Pingback: buy levitra 20 mg()
Pingback: levitra prices()
Pingback: levitra generic()
Pingback: cheap 20mg levitra()
Pingback: generic levitra()
Pingback: buy 20 mg levitra()
Pingback: buy vardenafil online()
Pingback: levitra online()
Pingback: cheap 10mg levitra()
Pingback: buy levitra online()
Pingback: 20mg levitra()
Pingback: cheap levitra 10mg()
Pingback: coupon vardenafil()
Pingback: buy levitra 10 mg()
Pingback: cheap 10 mg levitra()
Pingback: cheap levitra 10 mg()
Pingback: 10mg levitra()
Pingback: cheap levitra generic()
Pingback: buy levitra 10mg()
Pingback: buy levitra generic()
Pingback: levitra 20 mg()
Pingback: levitra 20mg()
Pingback: buy 10 mg levitra()
Pingback: vardenafil buy()
Pingback: online cialis()
Pingback: buy cialis()
Pingback: 200 cialis coupon()
Pingback: cialis generic()
Pingback: lowest cialis prices()
Pingback: purchasing cialis on the internet()
Pingback: buy tadalafil()
Pingback: interactions for cialis()
Pingback: cialis daily()
Pingback: cialis 20()
Pingback: buy 20 mg cialis()
Pingback: cheap generic cialis()
Pingback: tadalafil online()
Pingback: buy sildenafil()
Pingback: hard on viagra jelly online mail-order pharmacies()
Pingback: red viagra online mail-order pharmacies()
Pingback: buy generic viagra()
Pingback: cheap viagra online()
Pingback: pink female viagra online mail-order pharmacies()
Pingback: generic viagra available()
Pingback: viagra without a doctor prescription()
Pingback: buy viagra online()
Pingback: gold viagra online mail-order pharmacies()
Pingback: viagra for women online mail-order pharmacies()
Pingback: viagra 100mg()
Pingback: generic levitra()
Pingback: buy vardenafil()
Pingback: 20mg levitra()
Pingback: vardenafil buy()
Pingback: vardenafil 20mg()
Pingback: buy levitra generic()
Pingback: buy levitra 10 mg()
Pingback: cheap 20mg levitra()
Pingback: levitra buy()
Pingback: vardenafil()
Pingback: levitra 20 mg()
Pingback: 20 mg levitra()
Pingback: vardenafil 20mg()
Pingback: tadalafil generic()
Pingback: generic cialis()
Pingback: cialis 20mg()
Pingback: cialis online()
Pingback: cialis generic()
Pingback: cialis online()
Pingback: cialis online()
Pingback: buy generic cialis online()
Pingback: buy cheap cialis online()
Pingback: tadalafil generic()
Pingback: tadalafil 20mg()
Pingback: buy cialis()
Pingback: tadalafil generic()
Pingback: buy cialis()
Pingback: buy generic cialis online()
Pingback: buy cialis online()
Pingback: cialis generic()
Pingback: buy cheap cialis online()
Pingback: tadalafil 20mg()
Pingback: cialis 20mg()
Pingback: generic cialis()
Pingback: buy cialis online()
Pingback: tadalafil 20mg()
Pingback: tadalafil 20mg()
Pingback: generic cialis()
Pingback: buy generic cialis online()
Pingback: tadalafil generic cialis 20mg()
Pingback: cialis generic()
Pingback: cialis generic()
Pingback: buy generic cialis online()
Pingback: tadalafil 20mg()
Pingback: tadalafil generic cialis 20mg()
Pingback: tadalafil generic cialis 20mg()
Pingback: tadalafil generic cialis 20mg()
Pingback: tadalafil generic cialis 20mg()
Pingback: cialis generic()
Pingback: cialis online()
Pingback: generic cialis()
Pingback: cialis generic()
Pingback: generic cialis tadalafil()
Pingback: sildenafil 100mg()
Pingback: generic viagra 100mg()
Pingback: buy sildenafil online()
Pingback: generic viagra()
Pingback: viagra 100mg()
Pingback: buy viagra 100mg()
Pingback: generic viagra()
Pingback: buy sildenafil 100mg()
Pingback: buy viagra online()
Pingback: viagra 100mg()
Pingback: buy viagra()
Pingback: buy generic viagra online()
Pingback: buy sildenafil online()
Pingback: generic viagra sildenafil()
Pingback: buy generic viagra sildenafil 100mg()
Pingback: buy viagra online()
Pingback: buy viagra online()
Pingback: buy viagra()
Pingback: generic viagra sildenafil()
Pingback: buy viagra 100mg()
Pingback: buy generic viagra sildenafil 100mg()
Pingback: buy viagra()
Pingback: generic viagra()
Pingback: generic viagra()
Pingback: generic viagra sildenafil()
Pingback: buy viagra 100mg()
Pingback: generic viagra 100mg()
Pingback: buy sildenafil online()
Pingback: generic viagra()
Pingback: buy viagra online()
Pingback: generic viagra()
Pingback: generic viagra()
Pingback: buy viagra 100mg()
Pingback: buy generic viagra online()
Pingback: generic viagra()
Pingback: buy generic viagra()
Pingback: buy generic viagra online()
Pingback: generic viagra 100mg()
Pingback: buy viagra online()
Pingback: buy generic viagra online()
Pingback: generic viagra()
Pingback: buy viagra 100mg()
Pingback: generic viagra 100mg()
Pingback: buy generic viagra()
Pingback: buy viagra()
Pingback: viagra 100mg()
Pingback: generic viagra sildenafil 100mg()
Pingback: buy generic viagra()
Pingback: generic viagra sildenafil 100mg()
Pingback: buy generic viagra sildenafil()
Pingback: sildenafil 100mg()
Pingback: buy generic viagra sildenafil 100mg()
Pingback: generic viagra sildenafil 100mg()
Pingback: buy viagra online()
Pingback: buy viagra 100mg()
Pingback: buy viagra 100mg()
Pingback: buy generic viagra sildenafil 100mg()
Pingback: generic viagra()
Pingback: buy generic viagra sildenafil()
Pingback: buy generic viagra sildenafil 100mg()
Pingback: generic viagra sildenafil()
Pingback: buy viagra 100mg()
Pingback: buy generic viagra online()
Pingback: buy sildenafil 100mg()
Pingback: generic viagra sildenafil 100mg()
Pingback: buy viagra online()
Pingback: generic viagra 100mg()
Pingback: generic viagra sildenafil()
Pingback: buy generic viagra sildenafil 100mg()
Pingback: buy generic viagra online()
Pingback: buy sildenafil 100mg()
Pingback: buy viagra 100mg()
Pingback: generic viagra()
Pingback: viagra 100mg()
Pingback: sildenafil 100mg()
Pingback: generic viagra sildenafil 100mg()
Pingback: viagra 100mg()
Pingback: buy sildenafil online()
Pingback: buy generic viagra()
Pingback: generic viagra sildenafil 100mg()
Pingback: buy generic viagra sildenafil()
Pingback: sildenafil 100mg()
Pingback: buy sildenafil online()
Pingback: buy generic viagra sildenafil()
Pingback: buy viagra 100mg()
Pingback: buy viagra()
Pingback: buy generic viagra()
Pingback: generic viagra()
Pingback: generic viagra()
Pingback: buy generic viagra()
Pingback: buy generic viagra sildenafil 100mg()
Pingback: generic viagra()
Pingback: buy viagra()
Pingback: generic viagra 100mg()
Pingback: generic viagra()
Pingback: buy viagra online()
Pingback: generic viagra sildenafil 100mg()
Pingback: buy sildenafil online()
Pingback: buy viagra online()
Pingback: buy viagra 100mg()
Pingback: generic viagra 100mg()
Pingback: buy generic viagra sildenafil 100mg()
Pingback: generic viagra 100mg()
Pingback: buy generic viagra sildenafil 100mg()
Pingback: sildenafil 100mg()
Pingback: buy generic viagra online()
Pingback: buy generic viagra()
Pingback: generic viagra sildenafil 100mg()
Pingback: sildenafil 100mg()
Pingback: generic viagra sildenafil()
Pingback: buy viagra 100mg()
Pingback: generic viagra 100mg()
Pingback: generic viagra sildenafil 100mg()
Pingback: buy sildenafil 100mg()
Pingback: sildenafil 100mg()
Pingback: buy generic viagra()
Pingback: generic viagra()
Pingback: buy generic viagra sildenafil()
Pingback: buy generic viagra sildenafil()
Pingback: buy viagra 100mg()
Pingback: buy generic viagra()
Pingback: buy viagra()
Pingback: buy viagra online()
Pingback: buy generic viagra online()
Pingback: buy sildenafil 100mg()
Pingback: buy viagra 100mg()
Pingback: buy generic viagra sildenafil()
Pingback: viagra 100mg()
Pingback: buy viagra online()
Pingback: Cheap cialis()
Pingback: generic viagra sildenafil 100mg()
Pingback: generic viagra 100mg()
Pingback: buy generic viagra sildenafil 100mg()
Pingback: generic viagra sildenafil()
Pingback: sildenafil 100mg()
Pingback: buy generic viagra online()
Pingback: buy generic viagra sildenafil()
Pingback: buy generic viagra sildenafil 100mg()
Pingback: buy viagra 100mg()
Pingback: buy generic viagra sildenafil 100mg()
Pingback: buy generic viagra()
Pingback: buy sildenafil online()
Pingback: viagra 100mg()
Pingback: buy generic levitra online()
Pingback: generic levitra()
Pingback: buy levitra()
Pingback: levitra 20mg()
Pingback: vardenafil 20mg()
Pingback: generic levitra vardenafil()
Pingback: vardenafil generic levitra 20mg()
Pingback: vardenafil 20mg()
Pingback: vardenafil generic levitra 20mg()
Pingback: levitra 20mg()
Pingback: buy levitra()
Pingback: levitra online()
Pingback: buy generic levitra online()
Pingback: vardenafil generic()
Pingback: buy levitra online()
Pingback: buy levitra()
Pingback: levitra 20mg()
Pingback: levitra online()
Pingback: buy generic levitra online()
Pingback: vardenafil generic levitra 20mg()
Pingback: vardenafil generic levitra 20mg()
Pingback: vardenafil generic()
Pingback: vardenafil generic()
Pingback: vardenafil 20mg()
Pingback: levitra online()
Pingback: vardenafil generic levitra 20mg()
Pingback: buy levitra()
Pingback: generic levitra()
Pingback: levitra 20mg()
Pingback: generic levitra vardenafil()
Pingback: levitra 20mg()
Pingback: buy cheap levitra online()
Pingback: vardenafil generic levitra 20mg()
Pingback: buy levitra online()
Pingback: buy levitra()
Pingback: generic levitra vardenafil()
Pingback: generic levitra()
Pingback: buy levitra()
Pingback: buy levitra online()
Pingback: buy cheap levitra online()
Pingback: buy generic levitra online()
Pingback: vardenafil generic levitra 20mg()
Pingback: buy levitra online()
Pingback: buy generic levitra online()
Pingback: vardenafil generic levitra 20mg()
Pingback: generic levitra vardenafil()
Pingback: levitra online()
Pingback: levitra online()
Pingback: vardenafil 20mg()
Pingback: buy generic levitra online()
Pingback: vardenafil generic()
Pingback: levitra generic()
Pingback: generic levitra()
Pingback: levitra 20mg()
Pingback: vardenafil 20mg()
Pingback: levitra generic()
Pingback: buy cheap levitra online()
Pingback: levitra online()
Pingback: generic levitra()
Pingback: vardenafil 20mg()
Pingback: buy levitra online()
Pingback: generic levitra()
Pingback: buy cheap levitra online()
Pingback: buy levitra online()
Pingback: buy levitra()
Pingback: buy levitra()
Pingback: vardenafil 20mg()
Pingback: buy generic levitra online()
Pingback: buy generic levitra online()
Pingback: levitra online()
Pingback: generic levitra()
Pingback: levitra generic()
Pingback: levitra online()
Pingback: vardenafil 20mg()
Pingback: vardenafil 20mg()
Pingback: levitra 20mg()
Pingback: buy levitra()
Pingback: buy cheap levitra online()
Pingback: buy levitra online()
Pingback: vardenafil 20mg()
Pingback: buy cheap levitra online()
Pingback: generic levitra()
Pingback: generic levitra()
Pingback: generic levitra()
Pingback: vardenafil 20mg()
Pingback: buy generic levitra online()
Pingback: vardenafil 20mg()
Pingback: levitra generic()
Pingback: levitra generic()
Pingback: vardenafil 20mg()
Pingback: cryptobot()
Pingback: tradeing bot()
Pingback: tradeing bot()
Pingback: cryptobot()
Pingback: cryptobot()
Pingback: crypto trade bot()
Pingback: buy cialis online best price()
Pingback: cialis without a doctors prescription in usa()
Pingback: pralnia ko³czewo()
Pingback: northwest pharmacy canada()
Pingback: canadian pharmacy uk delivery()
Pingback: Cheap viagra()
Pingback: Viagra vs cialis()
Pingback: Viagra vs cialis()
Pingback: Viagra purchasing()
Pingback: deking()
Pingback: deking()
Pingback: deking()
Pingback: deking()
Pingback: декинг()
Pingback: deking()
Pingback: декинг()
Pingback: террасная доска()
Pingback: декинг()
Pingback: deking()
Pingback: online dating()
Pingback: dating()
Pingback: hookup()
Pingback: dating()
Pingback: hookup()
Pingback: dating()
Pingback: online dating()
Pingback: dating()
Pingback: Cialis generic()
Pingback: Buy cialis online()
Pingback: Viagra from canada()
Pingback: Viagra tablets australia()
Pingback: levitra generic alternative()
Pingback: vardenafil price()
Pingback: Discount viagra()
Pingback: buy viagra()
Pingback: отворот()
Pingback: приворот()
Pingback: заговор()
Pingback: заговор()
Pingback: приворот()
Pingback: заговор()
Pingback: приворот()
Pingback: отворот()
Pingback: заговор()
Pingback: приворот()
Pingback: приворот()
Pingback: приворот()
Pingback: заговор()
Pingback: приворот()
Pingback: заговор()
Pingback: отворот()
Pingback: заговор()
Pingback: заговор()
Pingback: заговор()
Pingback: отворот()
Pingback: слоты()
Pingback: игровые автоматы()
Pingback: игровые автоматы()
Pingback: игровые автоматы()
Pingback: слоты()
Pingback: казино()
Pingback: игровые автоматы()
Pingback: слоты()
Pingback: казино()
Pingback: казино()
Pingback: слоты()
Pingback: игровые автоматы()
Pingback: казино()
Pingback: игровые автоматы()
Pingback: игровые автоматы()
Pingback: игровые автоматы()
Pingback: игровые автоматы()
Pingback: игровые автоматы()
Pingback: игровые автоматы()
Pingback: казино()
Pingback: игровые автоматы()
Pingback: казино()
Pingback: слоты()
Pingback: слоты()
Pingback: игровые автоматы()
Pingback: слоты()
Pingback: игровые автоматы()
Pingback: казино()
Pingback: trading opciones()
Pingback: binary opciones()
Pingback: binary broker()
Pingback: trading opciones()
Pingback: trading opciones()
Pingback: binary broker()
Pingback: trading opciones()
Pingback: binary opciones()
Pingback: binary opciones()
Pingback: trading opciones()
Pingback: binary opciones()
Pingback: binary broker()
Pingback: binary opciones()
Pingback: binary broker()
Pingback: tradebot()
Pingback: tradebot()
Pingback: trade program()
Pingback: tradebot()
Pingback: tradebot()
Pingback: tradebot()
Pingback: cryptobot()
Pingback: cryptobot()
Pingback: cryptobot()
Pingback: cryptobot()
Pingback: trade program()
Pingback: tradebot()
Pingback: trade program()
Pingback: trade program()
Pingback: tradebot()
Pingback: trade program()
Pingback: trade program()
Pingback: trade program()
Pingback: cryptobot()
Pingback: trade program()
Pingback: trade program()
Pingback: cryptobot()
Pingback: trade program()
Pingback: levitra prices()
Pingback: viagra()
Pingback: viagra without prescription()
Pingback: buy viagra online()
Pingback: generic viagra()
Pingback: pharmeasy()
Pingback: canadian online pharmacies()
Pingback: online pharmacy()
Pingback: canadian pharmacy()
Pingback: pharmacies()
Pingback: tadalafil 20mg()
Pingback: tadalafil()
Pingback: generic cialis()
Pingback: tadalafil generic()
Pingback: canadian pharmacies()
Pingback: drugstore online()
Pingback: online pharmacies()
Pingback: viagra 100mg()
Pingback: buy viagra()
Pingback: купить виагру цена()
Pingback: гдз макарычев()
Pingback: гдз клас()
Pingback: гдз бархударов()
Pingback: гдз спиши()
Pingback: гдз 8()
Pingback: гдз мордкович 10 класс()
Pingback: гдз макарычев 7 класс()
Pingback: гдз по русскому баранов()
Pingback: гдз класс()
Pingback: гдз по геометрии 7 9 класс атанасян()
Pingback: гдз 8 класс()
Pingback: гдз по русскому языку()
Pingback: гдз по русскому языку 6()
Pingback: гдз геометрия 10()
Pingback: гдз по геометрии 10 класс()
Pingback: гдз мордкович 10 класс()
Pingback: гдз н()
Pingback: гдз по г()
Pingback: гдз 11 класс()
Pingback: гдз по английскому 10()
Pingback: гдз по алгебре 7 класс()
Pingback: гдз по геометрии класс атанасян()
Pingback: гдз по немецкому()