


Falling Crude Oil Prices: A Boon or A Bane?
The price for crude oil has been consistently falling for well over a year now. Most consumers feel that this is a good thing because it saves them money and increases their disposable income. However, what does this mean for local and global economies in the long term? Here is a chart showing the price of Crude Oil Futures over the last one year.
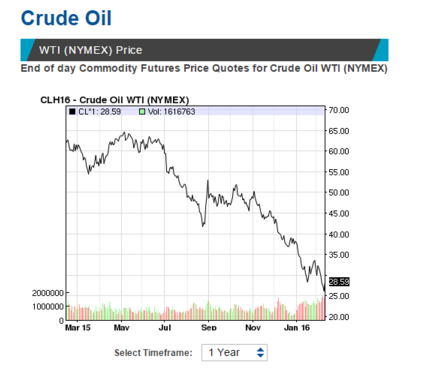
Source: http://www.nasdaq.com/markets/crude-oil.aspx
Impact on Gas Prices
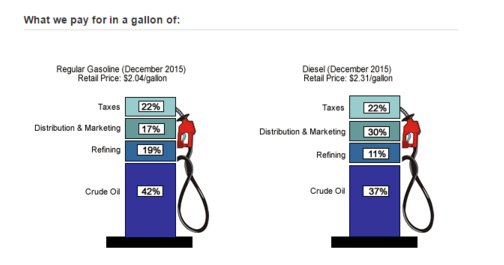
According to EIA’s latest Gasoline and Diesel Fuel Update, crude oil prices make up 42% of the price of gasoline. The rest of what we pay at the pump depends on taxes, distribution & marketing, and refining. Therefore, a fall in the price of crude oil translates to a fall in the price of gas and vice versa. This is better explained in the graphic below:
Impact on Consumer Retailers
Since Texas is the top producer of oil in the United States, it has been severely impacted by the slump in oil prices. 60,000 jobs have been cut by oil exploration and production companies in Texas so far. This trend is likely to continue in the near future. This would translate to people having less money to spend in stores. On January 15, 2016 Walmart (NYSE: WMT) announced that it was closing 269 stores, more than 10% of which were located in Texas.
Impact on Global Economy
The Organization of Petroleum Exporting Countries (OPEC) has 12 members which control 61% of the world’s oil exports. OPEC said recently “the overall negative effect from the sharp decline in oil prices since mid-2014 has outweighed benefits in the short term”.
The global demand for oil is falling because consumers are cutting back on car transport. However, OPEC members are still supplying the same amount of oil to the world because they don’t want to see their market share drop. The other factor impacting the price of oil seems to be market sentiment. OPEC members include: Iran, Iraq, Kuwait, Saudi Arabia, Venezuela, Qatar, Indonesia, Libya, UAE, Algeria, Nigeria and Angola. The president of Venezuela has announced an economic state of emergency and Nigeria has asked for $3.5 billion in loans from the World Bank and the African Development Bank. Saudi Arabia and Russia are not in good financial positions either. If countries which are dependent on oil exports alone go bust as a result of falling oil prices, the IMF and World Bank may not have money to bail them out.
Impact on Stocks
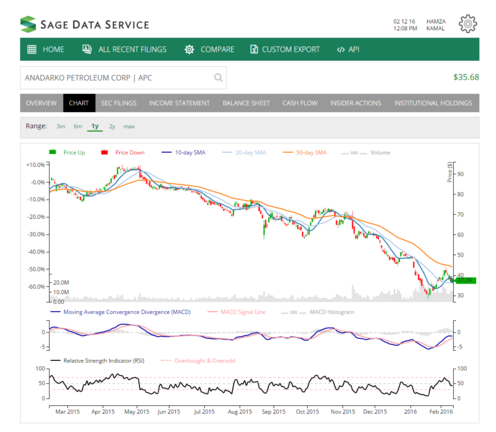
Upstream oil producers are feeling the maximum pinch because their costs to produce oil exceed the market price. Hence, they end up with incurring huge losses. Here is a chart for the stock price of Anadarko Petroleum (NYSE: APC). About a year ago, the price was over $80 per share. Currently, it’s trading at $37.51 per share. This seems to be the trend among other companies in the industry such as Transocean LTD (NYSE:RIG) and Nabors Industries Ltd. (NYSE:NBR):
Falling oil prices aren’t bad news only for the oil exploration companies. Industrial and materials companies such as United States Steel Corp. (NYSE:X) are being impacted and so are financial companies. Companies such as United States Steel Corp. (NYSE:X) supply materials to oil and gas companies to build their infrastructure. Finance companies lent huge amounts of money to exploration companies as capital when the demand for oil was high.
Even though it may feel great to pay less than $1.45 for a gallon of gasoline to the average consumer, there are bigger factors at play. This decline in the price of oil has resulted in hundreds and thousands of people losing their jobs and entire countries are at the brink of failing.
Sources:
- http://sagedataservice.com/
- http://news.walmart.com/news-archive/2016/01/15/walmart-continues-sharpened-focus-on-portfolio-management
- http://www.eia.gov/petroleum/gasdiesel/
- https://www.eia.gov/state/rankings/#/series/46
Pingback: New Releases()
Pingback: Best Magazine in India()
Pingback: bonus casino()
Pingback: Entertainment and Movie reviews with tips on how to get Website Traffic and Make Money Online.()
Pingback: Best Newspaper in India()
Pingback: economics tuition()
Pingback: economics tuition()
Pingback: immortal plc()
Pingback: joseph de saram()
Pingback: joseph s r de saram()
Pingback: joseph shihara rukshan de saram()
Pingback: joseph de saram()
Pingback: find yourgood looking bohemina style clothes()
Pingback: bio-ethanol haard kopen()
Pingback: halotestin buy()
Pingback: dryer vent cleaners near me()
Pingback: Sandra balan()
Pingback: parenting()
Pingback: humatrope for bodybuilding()
Pingback: erotik outlet()
Pingback: kimim ben()
Pingback: arnaque serrurier()
Pingback: body pharm()
Pingback: n2guard()
Pingback: click here to hire a lawyer()
Pingback: where to get trenbolone()
Pingback: m88.com()
Pingback: basement()
Pingback: http://www.godwinsremovals.co.uk/international-removals/northern-ireland()
Pingback: College Counseling()
Pingback: android games()
Pingback: kimsin sen()
Pingback: Skrota bilen Göteborg()
Pingback: Skrota bilen Göteborg()
Pingback: brook stagles()
Pingback: VA Home Loans()
Pingback: letroplex()
Pingback: photography galleries()
Pingback: 5ivemile photography,fivemile photography,Photographers in Birmingham alabama, Photographers in Birmingham al, best photographers in birmingham al,Photographers Birmingham Alabama,Birmingham Alabama photographers, family photographers in birmingham al,Birmingham al photographers()
Pingback: Office-experts.info()
Pingback: hcg diet plain()
Pingback: Zorgverzekeringen()
Pingback: Loterij()
Pingback: mobic meloxicam 15 mg()
Pingback: vardenafil prices()
Pingback: generic cialis at walmart()
Pingback: trust pharmacy cialis()
Pingback: download on mobile541 afeu23na3124 abdu23na70()
Pingback: cialis generic()
Pingback: buy viagra()
Pingback: viagra oral jelly online mail-order pharmacies()
Pingback: viagra plus online mail-order pharmacies()
Pingback: where to buy viagra()
Pingback: superdrug viagra()
Pingback: viagra online paypal uk()
Pingback: cheap viagra 100 mg()
Pingback: sildenafil()
Pingback: buy viagra 100mg()
Pingback: cheap viagra 100mg()
Pingback: pink female viagra online mail-order pharmacies()
Pingback: viagra professional online mail-order pharmacies()
Pingback: viagra 100mg()
Pingback: cheap 100mg viagra()
Pingback: viagra()
Pingback: buy viagra 100 mg()
Pingback: viagra substitute()
Pingback: sildenafil online()
Pingback: over the counter viagra()
Pingback: buy 100mg viagra()
Pingback: coupon sildenafil()
Pingback: buy viagra 50mg()
Pingback: order viagra()
Pingback: viagra on line()
Pingback: sildenafil buy()
Pingback: buy sildenafil online()
Pingback: cheap 100 mg viagra()
Pingback: viagra 100 mg()
Pingback: cheap viagra 50 mg()
Pingback: generic for viagra()
Pingback: viagra soft tabs online mail-order pharmacies()
Pingback: viagra samples()
Pingback: viagra tablets()
Pingback: sildenafil prices()
Pingback: cheap sildenafil online()
Pingback: viagra over the counter()
Pingback: generic viagra()
Pingback: 50mg viagra()
Pingback: viagra canada()
Pingback: cheap viagra generic()
Pingback: buy viagra online()
Pingback: cheap 50mg viagra()
Pingback: order viagra online()
Pingback: tesco viagra()
Pingback: buy sildenafil()
Pingback: viagra generic()
Pingback: viagra for women online mail-order pharmacies()
Pingback: buy generic viagra()
Pingback: viagra coupon()
Pingback: online viagra()
Pingback: buy viagra generic()
Pingback: cheap levitra 10mg()
Pingback: cheap 10 mg levitra()
Pingback: levitra 20 mg()
Pingback: vardenafil buy()
Pingback: levitra online()
Pingback: buy 20 mg levitra()
Pingback: levitra generic()
Pingback: cheap levitra 20mg()
Pingback: buy levitra online()
Pingback: buy levitra 20mg()
Pingback: cheap vardenafil online()
Pingback: levitra 20mg()
Pingback: 20 mg levitra()
Pingback: vardenafil cost()
Pingback: levitra cost()
Pingback: levitra prices()
Pingback: buy levitra 10mg()
Pingback: buy 20mg levitra()
Pingback: buy 10mg levitra()
Pingback: cheap levitra 10 mg()
Pingback: coupon vardenafil()
Pingback: vardenafil()
Pingback: cheap levitra online()
Pingback: levitra()
Pingback: buy levitra generic()
Pingback: vardenafil online()
Pingback: buy levitra 20 mg()
Pingback: levitra 10 mg prezzo()
Pingback: 20mg levitra()
Pingback: levitra coupon()
Pingback: cheap levitra 20 mg()
Pingback: cheap 20mg levitra()
Pingback: buy levitra()
Pingback: levitra 20 mg bayer prezzo()
Pingback: buy generic levitra()
Pingback: 10 mg levitra()
Pingback: cheap levitra generic()
Pingback: generic levitra()
Pingback: tadalafil buy()
Pingback: purchasing cialis on the internet()
Pingback: black cialis online mail-order pharmacies()
Pingback: buy cialis now()
Pingback: coupon tadalafil()
Pingback: tadalafil 20 mg()
Pingback: cialis generic availability()
Pingback: cialis printable coupons()
Pingback: buy tadalafil()
Pingback: cialis 20 mg best price()
Pingback: cialis 5mg()
Pingback: cialis tablets 5mg-10mg or 20 mg()
Pingback: coupon cialis()
Pingback: buy cialis 20mg()
Pingback: cialis samples()
Pingback: buy 20 mg cialis()
Pingback: cialis professional online mail-order pharmacies()
Pingback: generic cialis tadalafil()
Pingback: natural viagra()
Pingback: viagra buy()
Pingback: generic viagra online()
Pingback: viagra capsules online mail-order pharmacies()
Pingback: 50 mg viagra()
Pingback: pfizer viagra()
Pingback: cheap viagra()
Pingback: women viagra()
Pingback: womens viagra()
Pingback: generic viagra online mail-order pharmacies()
Pingback: viagra natural()
Pingback: viagra generic availability()
Pingback: viagra cost()
Pingback: gold viagra online mail-order pharmacies()
Pingback: viagra uk()
Pingback: viagra for women()
Pingback: sildenafil cost()
Pingback: cheap generic viagra()
Pingback: levitra online()
Pingback: buy levitra generic()
Pingback: buy levitra 20mg()
Pingback: cheap 10 mg levitra()
Pingback: buy 10mg levitra()
Pingback: levitra 20 mg bayer prezzo()
Pingback: vardenafil coupon()
Pingback: vardenafil online()
Pingback: vardenafil online()
Pingback: buy generic levitra()
Pingback: levitra coupon()
Pingback: buy levitra 20 mg()
Pingback: cheap levitra 20 mg()
Pingback: tadalafil generic()
Pingback: cialis generic()
Pingback: generic cialis tadalafil()
Pingback: buy cheap cialis online()
Pingback: tadalafil generic()
Pingback: buy cialis()
Pingback: cialis 20mg()
Pingback: tadalafil generic cialis 20mg()
Pingback: tadalafil generic()
Pingback: buy cialis online()
Pingback: generic cialis tadalafil()
Pingback: buy cialis()
Pingback: tadalafil generic()
Pingback: generic cialis()
Pingback: buy cialis online()
Pingback: buy cialis online()
Pingback: cialis 20mg()
Pingback: cialis online()
Pingback: generic cialis tadalafil()
Pingback: cialis online()
Pingback: buy cialis online()
Pingback: tadalafil 20mg()
Pingback: cialis online()
Pingback: generic cialis tadalafil()
Pingback: generic cialis()
Pingback: cialis generic()
Pingback: cialis online()
Pingback: buy cialis()
Pingback: cialis 20mg()
Pingback: cialis generic()
Pingback: generic cialis()
Pingback: cialis generic()
Pingback: generic cialis()
Pingback: cialis generic()
Pingback: buy cheap cialis online()
Pingback: cialis online()
Pingback: cialis generic()
Pingback: buy cheap cialis online()
Pingback: generic cialis()
Pingback: cialis generic()
Pingback: sildenafil 100mg()
Pingback: buy viagra 100mg()
Pingback: buy generic viagra()
Pingback: generic viagra()
Pingback: generic viagra()
Pingback: buy generic viagra online()
Pingback: buy sildenafil 100mg()
Pingback: buy viagra 100mg()
Pingback: generic viagra sildenafil 100mg()
Pingback: viagra 100mg()
Pingback: buy generic viagra sildenafil()
Pingback: buy sildenafil online()
Pingback: buy generic viagra sildenafil()
Pingback: generic viagra sildenafil()
Pingback: generic viagra 100mg()
Pingback: buy viagra online()
Pingback: buy generic viagra sildenafil 100mg()
Pingback: buy generic viagra sildenafil 100mg()
Pingback: generic viagra sildenafil 100mg()
Pingback: buy viagra()
Pingback: buy viagra()
Pingback: buy viagra online()
Pingback: buy sildenafil online()
Pingback: sildenafil 100mg()
Pingback: buy generic viagra sildenafil()
Pingback: generic viagra sildenafil 100mg()
Pingback: generic viagra sildenafil 100mg()
Pingback: buy viagra online()
Pingback: sildenafil 100mg()
Pingback: buy sildenafil online()
Pingback: buy viagra()
Pingback: buy sildenafil online()
Pingback: buy viagra online()
Pingback: generic viagra sildenafil()
Pingback: buy generic viagra()
Pingback: generic viagra()
Pingback: buy viagra()
Pingback: buy generic viagra sildenafil()
Pingback: buy viagra online()
Pingback: buy sildenafil 100mg()
Pingback: buy generic viagra()
Pingback: sildenafil 100mg()
Pingback: generic viagra 100mg()
Pingback: buy generic viagra sildenafil 100mg()
Pingback: generic viagra 100mg()
Pingback: generic viagra()
Pingback: generic viagra sildenafil()
Pingback: buy viagra()
Pingback: buy generic viagra sildenafil()
Pingback: generic viagra 100mg()
Pingback: buy viagra 100mg()
Pingback: buy sildenafil online()
Pingback: generic viagra sildenafil()
Pingback: buy sildenafil online()
Pingback: viagra 100mg()
Pingback: viagra 100mg()
Pingback: buy sildenafil 100mg()
Pingback: generic viagra sildenafil()
Pingback: generic viagra sildenafil()
Pingback: buy sildenafil online()
Pingback: buy viagra online()
Pingback: buy generic viagra sildenafil()
Pingback: buy viagra 100mg()
Pingback: generic viagra sildenafil 100mg()
Pingback: buy viagra online()
Pingback: buy generic viagra sildenafil 100mg()
Pingback: buy viagra online()
Pingback: generic viagra()
Pingback: generic viagra()
Pingback: sildenafil 100mg()
Pingback: generic viagra()
Pingback: buy generic viagra()
Pingback: generic viagra()
Pingback: generic viagra()
Pingback: buy generic viagra sildenafil 100mg()
Pingback: buy generic viagra sildenafil()
Pingback: generic viagra 100mg()
Pingback: generic viagra 100mg()
Pingback: generic viagra()
Pingback: buy viagra 100mg()
Pingback: generic viagra sildenafil()
Pingback: sildenafil 100mg()
Pingback: buy generic viagra sildenafil 100mg()
Pingback: generic viagra sildenafil()
Pingback: buy sildenafil 100mg()
Pingback: buy viagra online()
Pingback: generic viagra()
Pingback: buy viagra()
Pingback: buy generic viagra()
Pingback: generic viagra 100mg()
Pingback: buy viagra()
Pingback: buy generic viagra()
Pingback: generic viagra()
Pingback: viagra 100mg()
Pingback: buy generic viagra sildenafil 100mg()
Pingback: sildenafil 100mg()
Pingback: buy generic viagra online()
Pingback: buy viagra online()
Pingback: generic viagra 100mg()
Pingback: viagra 100mg()
Pingback: generic viagra()
Pingback: generic viagra 100mg()
Pingback: sildenafil 100mg()
Pingback: buy viagra 100mg()
Pingback: buy sildenafil online()
Pingback: buy viagra()
Pingback: buy viagra 100mg()
Pingback: buy sildenafil online()
Pingback: generic viagra sildenafil 100mg()
Pingback: buy sildenafil online()
Pingback: generic viagra sildenafil()
Pingback: generic viagra()
Pingback: buy viagra()
Pingback: sildenafil 100mg()
Pingback: buy viagra()
Pingback: generic viagra sildenafil()
Pingback: viagra 100mg()
Pingback: generic viagra 100mg()
Pingback: generic viagra 100mg()
Pingback: generic viagra 100mg()
Pingback: buy generic viagra sildenafil()
Pingback: buy sildenafil 100mg()
Pingback: buy sildenafil online()
Pingback: generic viagra()
Pingback: viagra 100mg()
Pingback: buy generic viagra sildenafil 100mg()
Pingback: buy sildenafil 100mg()
Pingback: buy viagra()
Pingback: buy generic viagra online()
Pingback: buy sildenafil 100mg()
Pingback: buy sildenafil 100mg()
Pingback: generic viagra()
Pingback: buy generic viagra sildenafil()
Pingback: generic viagra sildenafil()
Pingback: buy viagra online()
Pingback: buy viagra()
Pingback: generic viagra sildenafil()
Pingback: generic viagra sildenafil 100mg()
Pingback: buy viagra()
Pingback: sildenafil 100mg()
Pingback: buy generic viagra sildenafil()
Pingback: generic viagra 100mg()
Pingback: buy generic levitra online()
Pingback: levitra generic()
Pingback: buy cheap levitra online()
Pingback: generic levitra()
Pingback: buy levitra()
Pingback: generic levitra vardenafil()
Pingback: buy levitra online()
Pingback: vardenafil 20mg()
Pingback: buy cheap levitra online()
Pingback: generic levitra vardenafil()
Pingback: vardenafil generic()
Pingback: buy cheap levitra online()
Pingback: vardenafil 20mg()
Pingback: levitra generic()
Pingback: buy levitra()
Pingback: vardenafil generic levitra 20mg()
Pingback: generic levitra vardenafil()
Pingback: levitra generic()
Pingback: vardenafil 20mg()
Pingback: generic levitra()
Pingback: buy generic levitra online()
Pingback: buy levitra online()
Pingback: vardenafil generic levitra 20mg()
Pingback: generic levitra()
Pingback: vardenafil 20mg()
Pingback: levitra online()
Pingback: levitra online()
Pingback: levitra 20mg()
Pingback: levitra generic()
Pingback: generic levitra vardenafil()
Pingback: vardenafil 20mg()
Pingback: vardenafil generic()
Pingback: vardenafil generic levitra 20mg()
Pingback: vardenafil generic()
Pingback: vardenafil 20mg()
Pingback: vardenafil generic levitra 20mg()
Pingback: vardenafil 20mg()
Pingback: vardenafil generic()
Pingback: generic levitra vardenafil()
Pingback: buy levitra()
Pingback: buy generic levitra online()
Pingback: generic levitra()
Pingback: generic levitra vardenafil()
Pingback: buy cheap levitra online()
Pingback: buy levitra online()
Pingback: vardenafil generic levitra 20mg()
Pingback: buy levitra()
Pingback: vardenafil 20mg()
Pingback: vardenafil 20mg()
Pingback: buy generic levitra online()
Pingback: levitra 20mg()
Pingback: levitra online()
Pingback: buy levitra()
Pingback: buy cheap levitra online()
Pingback: vardenafil 20mg()
Pingback: generic levitra()
Pingback: levitra online()
Pingback: buy cheap levitra online()
Pingback: vardenafil 20mg()
Pingback: buy generic levitra online()
Pingback: levitra generic()
Pingback: levitra 20mg()
Pingback: vardenafil 20mg()
Pingback: levitra 20mg()
Pingback: levitra generic()
Pingback: buy levitra()
Pingback: buy cheap levitra online()
Pingback: levitra online()
Pingback: levitra online()
Pingback: levitra 20mg()
Pingback: levitra generic()
Pingback: generic levitra()
Pingback: buy levitra online()
Pingback: levitra online()
Pingback: levitra 20mg()
Pingback: buy levitra()
Pingback: buy generic levitra online()
Pingback: buy levitra()
Pingback: generic levitra()
Pingback: buy levitra online()
Pingback: generic levitra()
Pingback: buy cheap levitra online()
Pingback: levitra generic()
Pingback: generic levitra()
Pingback: buy levitra online()
Pingback: vardenafil 20mg()
Pingback: vardenafil 20mg()
Pingback: levitra 20mg()
Pingback: buy levitra online()
Pingback: tradeing bot()
Pingback: tradeing bot()
Pingback: crypto trade bot()
Pingback: cryptobot()
Pingback: crypto trade bot()
Pingback: tradeing bot()
Pingback: RuneScape Bot()
Pingback: best executive resume writer()
Pingback: empresa assistência informática()
Pingback: deking()
Pingback: deking()
Pingback: декинг()
Pingback: террасная доска()
Pingback: deking()
Pingback: декинг()
Pingback: декинг()
Pingback: deking()
Pingback: декинг()
Pingback: dating()
Pingback: dating()
Pingback: dating()
Pingback: hookup()
Pingback: online dating()
Pingback: online dating()
Pingback: online dating()
Pingback: dating()
Pingback: отворот()
Pingback: отворот()
Pingback: приворот()
Pingback: отворот()
Pingback: заговор()
Pingback: заговор()
Pingback: отворот()
Pingback: заговор()
Pingback: отворот()
Pingback: отворот()
Pingback: заговор()
Pingback: отворот()
Pingback: заговор()
Pingback: отворот()
Pingback: отворот()
Pingback: приворот()
Pingback: приворот()
Pingback: приворот()
Pingback: слоты()
Pingback: слоты()
Pingback: слоты()
Pingback: слоты()
Pingback: казино()
Pingback: казино()
Pingback: казино()
Pingback: слоты()
Pingback: слоты()
Pingback: игровые автоматы()
Pingback: игровые автоматы()
Pingback: казино()
Pingback: казино()
Pingback: казино()
Pingback: казино()
Pingback: слоты()
Pingback: игровые автоматы()
Pingback: игровые автоматы()
Pingback: игровые автоматы()
Pingback: игровые автоматы()
Pingback: казино()
Pingback: игровые автоматы()
Pingback: казино()
Pingback: слоты()
Pingback: казино()
Pingback: казино()
Pingback: игровые автоматы()
Pingback: игровые автоматы()
Pingback: игровые автоматы()
Pingback: слоты()
Pingback: trading opciones()
Pingback: binary opciones()
Pingback: binary opciones()
Pingback: binary broker()
Pingback: binary opciones()
Pingback: trading opciones()
Pingback: binary opciones()
Pingback: binary broker()
Pingback: trading opciones()
Pingback: binary broker()
Pingback: trading opciones()
Pingback: trading opciones()
Pingback: tradebot()
Pingback: tradebot()
Pingback: cryptobot()
Pingback: tradebot()
Pingback: tradebot()
Pingback: trade program()
Pingback: trade program()
Pingback: tradebot()
Pingback: cryptobot()
Pingback: tradebot()
Pingback: tradebot()
Pingback: cryptobot()
Pingback: tradebot()
Pingback: trade program()
Pingback: tradebot()
Pingback: cryptobot()
Pingback: cryptobot()
Pingback: cryptobot()
Pingback: cryptobot()
Pingback: tradebot()
Pingback: trade program()
Pingback: canadianpharmacystorm.com()
Pingback: genericvgrmax.com()
Pingback: viagrawithoutdoctorspres.com()
Pingback: canpharmb3.com()
Pingback: ciapwronline.com()