


The WrestleMania Bump
For wrestling fans everywhere, the Royal Rumble begins the greatest season for professional wrestling. It starts the road to WrestleMania, the organizations biggest show of the year. The event provides memories that will last a lifetime. Who can forget Hulk Hogan body slamming the behemoth Andre the Giant? How about the Hulkster taking the WWF World Title from the Iraqi-sympathizing Sgt. Slaughter during the Gulf War? WrestleMania, much like the SuperBowl, is about creating stories that you will talk about all year, and perhaps all your life.
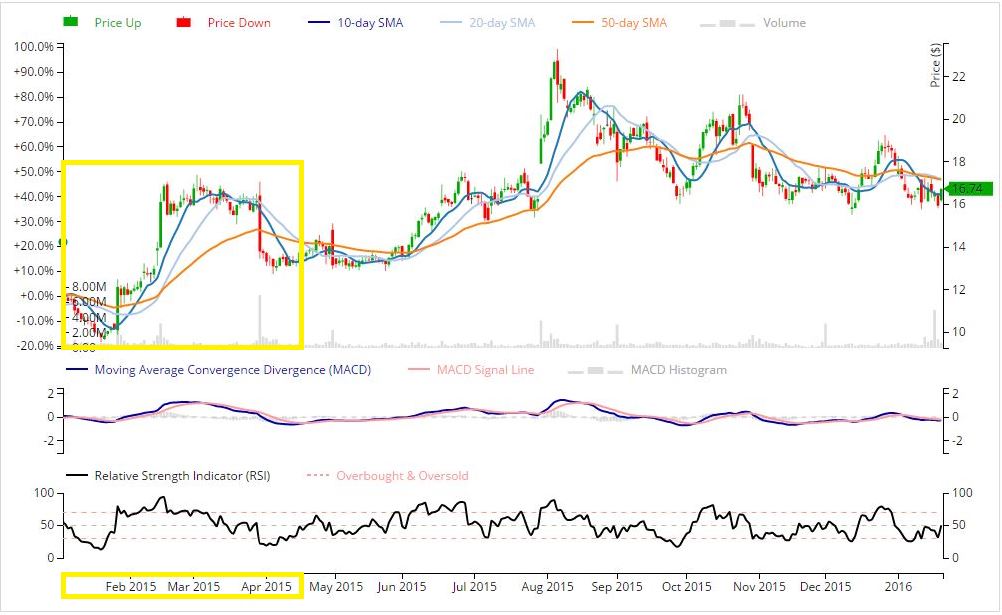
Over the past two years there has been a curious movement in the stock market during this time that I have dubbed the “WrestleMania Bump”. The term “bump” refers to the fall a wrestler takes when a move is delivered in the match. The term in this sense is used to describe the fall that takes place post-WrestleMania with the WWE stock. At the beginning of the year, right around the Royal Rumble, the stock begins to rise, and by the end of March or beginning of April, the stock begins to drop. The image below, highlighted in yellow from Sage’s Research Platform, shows the gain and drop from 2015. Two years is a coincidence, but would three straight years indicate a continuous pattern?
I’ve done research as to why the organization would see the stock increase during this time. Earnings get released for the fourth quarter in February, so that does not seem like it would be an effect. There were no major unusual events within the organization during this time that would have a pronounced effect on stock price. Searching through insider trading and institutional holding actions yielded nothing significant as well. Financial statements would not impact this over a prolonged period. All traditional methods have been analyzed in an attempt to rationalize this price behavior.
The price of the WWE stock as of 1/25/2016 is $16.74. It is already down about a dollar per share since the start of the year. The company holds solid liquidity ratios with profitability and efficiency ratios on the rise. The potentially troubling statistic is the trailing twelve-month price to earnings ratio of 56.10. This puts the organization in a tough position. They must either live up to the lofty expectations or risk the price of the stock coming down to a more reflective price. The WWE organization is tough to compare with other organizations in the same industry in terms of SIC code because they are truly a one of a kind entity.
A few months ago, I wrote about Weight Watchers and their dramatic increase in stock price. The stock, at the peak, crossed the $26 mark. Just a few short months later and the stock is moving at around $11.50. Why? The reason is the same reason that the WWE stock moves up during the WrestleMania season: perception. The perception for Weight Watchers was that Oprah was going to lead the organization to new heights with her investment. Demand was through the roof, and the stock almost quadrupled within a few weeks. The stock is still up overall, something like $4-$5 a share, but nothing like what the movement of the market after her announcement dictated. The perception for the WWE is similar: WWE does good business during WrestleMania because, at 32 years of age, it has become something of an American classic. Those who know the industry know this, and try to capitalize on the short swing the season produces.
That isn’t to say Vince McMahon, CEO of WWE, isn’t a good businessman. He has built an empire in an industry that most don’t dare step into. He has moved the organization into the future by using an emergent strategy to hedge his bets with network television by creating a proprietary digital subscriber channel: the WWE network. The onscreen decisions occasionally leave much to be desired, but McMahon has still done wonders to move his company in the right direction. He has ensured that when it is time for him to step aside, the strategy moving forward is sound and well planned.
With all that being said, it will be interesting to see if this is the third year with the so called “WrestleMania Bump”. WrestleMania has become a tradition spanning three decades, but it also started in a much smaller capacity than it is today. McMahon appears to be an expert at creating traditions. Perhaps this will be the final tradition he creates, even if by accident, before his time as CEO ceases to exist.
Pingback: backlink checker chrome()
Pingback: New Albums()
Pingback: why does my cat stare at me()
Pingback: Best Newspaper in India()
Pingback: Hollow Concrete Block()
Pingback: vipvip club()
Pingback: Best Newspaper in India()
Pingback: how do you take clenbuterol()
Pingback: joseph s r de saram()
Pingback: joe de saram()
Pingback: sfeerhaard kopen()
Pingback: surrogacy services()
Pingback: law firms trinidad()
Pingback: kimsin sen()
Pingback: cul()
Pingback: testo gen()
Pingback: http://www.mckenzieandwillis.co.nz/()
Pingback: hire an attorney()
Pingback: Denver Uber Driver()
Pingback: human growth hormone supplements()
Pingback: http://www.godwinsremovals.co.uk/international-removals/northern-ireland()
Pingback: Tecnologia de Informação e Comunicação()
Pingback: content()
Pingback: free download()
Pingback: download free()
Pingback: kid fights over girl()
Pingback: Bilskrot Göteborg()
Pingback: trumpforchildren()
Pingback: Bilskrot Göteborg()
Pingback: masonry()
Pingback: http://www.friv.run()
Pingback: site()
Pingback: http://www.juegosfriv.one()
Pingback: Schafwolle Unterbett()
Pingback: Nonis café, nonis café,Places to eat in Birmingham al, nonis cafe birmingham al, nonis cafe menu,Best restaurants in Birmingham al,places to eat in 5 points south birmingham al,five points birmingham restaurants()
Pingback: 客户偏好()
Pingback: Localsnowremoval.info()
Pingback: click site()
Pingback: sol partners mark()
Pingback: Trekking Loterij()
Pingback: Zorgtoeslag()
Pingback: TS Escorts UK()
Pingback: More about the author()
Pingback: deca decanoate()
Pingback: hucog 10000()
Pingback: link()
Pingback: wallstreet forex 2.0, forex robot, forex trading robot, best forex software, forex software, forex trading software, trading software()
Pingback: mobic meloxicam 15 mg()
Pingback: buy cialis 20 mg()
Pingback: vardenafil online()
Pingback: cialis 5mg()
Pingback: coupon for cialis by manufacturer()
Pingback: female cialis online mail-order pharmacies()
Pingback: cheap 50 mg viagra()
Pingback: buy viagra()
Pingback: viagra generic()
Pingback: viagra 100mg()
Pingback: buy generic viagra()
Pingback: buy 50 mg viagra()
Pingback: cheap generic viagra()
Pingback: online viagra()
Pingback: female viagra()
Pingback: over the counter viagra()
Pingback: buy viagra 100 mg()
Pingback: viagra buy()
Pingback: sildenafil()
Pingback: red viagra online mail-order pharmacies()
Pingback: viagra canada()
Pingback: generic viagra online mail-order pharmacies()
Pingback: buy sildenafil()
Pingback: viagra soft tabs online mail-order pharmacies()
Pingback: generic viagra prices()
Pingback: viagra samples()
Pingback: viagra online()
Pingback: sildenafil buy()
Pingback: gold viagra online mail-order pharmacies()
Pingback: viagra pills()
Pingback: hard on viagra jelly online mail-order pharmacies()
Pingback: brand viagra online mail-order pharmacies()
Pingback: viagra without a doctor prescription()
Pingback: cheap 50mg viagra()
Pingback: cheap 100 mg viagra()
Pingback: viagra online paypal uk()
Pingback: womens viagra()
Pingback: coupon sildenafil()
Pingback: viagra for men()
Pingback: viagra cost()
Pingback: 100 mg viagra()
Pingback: generic viagra available()
Pingback: viagra for sale()
Pingback: buy sildenafil online()
Pingback: generic viagra online()
Pingback: sildenafil coupon()
Pingback: 50 mg viagra()
Pingback: viagra plus online mail-order pharmacies()
Pingback: buy 50mg viagra()
Pingback: sildenafil online()
Pingback: pfizer viagra()
Pingback: sildenafil prices()
Pingback: viagra super active online mail-order pharmacies()
Pingback: generic for viagra()
Pingback: viagra 100 mg()
Pingback: buy viagra 50 mg()
Pingback: 100mg viagra()
Pingback: levitra 10 mg()
Pingback: levitra online()
Pingback: buy levitra 10mg()
Pingback: cheap 10mg levitra()
Pingback: cheap 20mg levitra()
Pingback: buy levitra online()
Pingback: buy 10mg levitra()
Pingback: cheap generic levitra()
Pingback: levitra coupon()
Pingback: levitra()
Pingback: coupon vardenafil()
Pingback: buy 20mg levitra()
Pingback: coupon levitra()
Pingback: 10 mg levitra()
Pingback: levitra 20 mg()
Pingback: 20mg levitra()
Pingback: buy levitra()
Pingback: buy 10 mg levitra()
Pingback: buy generic levitra()
Pingback: levitra 20mg()
Pingback: buy vardenafil()
Pingback: vardenafil cost()
Pingback: cheap vardenafil online()
Pingback: vardenafil coupon()
Pingback: levitra 10 mg prezzo()
Pingback: generic levitra()
Pingback: 20 mg levitra()
Pingback: levitra prices()
Pingback: vardenafil()
Pingback: cheap levitra online()
Pingback: levitra 10mg()
Pingback: buy levitra 10 mg()
Pingback: vardenafil buy()
Pingback: levitra buy()
Pingback: vardenafil 20mg()
Pingback: cheap levitra 20 mg()
Pingback: cheap levitra 10mg()
Pingback: cheap levitra 20mg()
Pingback: buy levitra generic()
Pingback: lowest cialis prices()
Pingback: buy tadalafil()
Pingback: 20mg cialis()
Pingback: buy cialis online()
Pingback: cialis 30 day sample()
Pingback: buy cialis now()
Pingback: generic cialis at walmart()
Pingback: cialis 20 mg()
Pingback: buy 20mg cialis()
Pingback: buy 20 mg cialis()
Pingback: canadian cialis()
Pingback: cialis daily()
Pingback: cialis cost()
Pingback: cialis 20()
Pingback: 20 mg cialis()
Pingback: cialis for daily use()
Pingback: tadalafil cost()
Pingback: cialis tablets()
Pingback: viagra oral jelly online mail-order pharmacies()
Pingback: female viagra pills()
Pingback: 100 mg viagra lowest price()
Pingback: natural viagra()
Pingback: viagra coupon()
Pingback: viagra for women online mail-order pharmacies()
Pingback: viagra capsules online mail-order pharmacies()
Pingback: pink female viagra online mail-order pharmacies()
Pingback: buy viagra 100mg()
Pingback: pink viagra online mail-order pharmacies()
Pingback: viagra 50 mg()
Pingback: buy viagra online()
Pingback: viagra natural()
Pingback: viagra prices()
Pingback: where to buy viagra()
Pingback: sildenafil citrate()
Pingback: buy levitra online()
Pingback: cheap levitra 10mg()
Pingback: vardenafil 20mg()
Pingback: levitra 20 mg()
Pingback: buy levitra generic()
Pingback: cheap levitra 10 mg()
Pingback: buy levitra 10mg()
Pingback: levitra coupon()
Pingback: buy levitra 10mg()
Pingback: levitra generic()
Pingback: buy levitra online()
Pingback: levitra generic()
Pingback: cheap levitra online()
Pingback: buy cialis()
Pingback: buy cialis()
Pingback: cialis generic()
Pingback: cialis generic()
Pingback: buy cheap cialis online()
Pingback: buy generic cialis online()
Pingback: buy cialis online()
Pingback: tadalafil 20mg()
Pingback: cialis 20mg()
Pingback: buy cialis online()
Pingback: buy cialis online()
Pingback: buy generic cialis online()
Pingback: cialis generic()
Pingback: cialis 20mg()
Pingback: tadalafil 20mg()
Pingback: buy cheap cialis online()
Pingback: buy generic cialis online()
Pingback: cialis 20mg()
Pingback: cialis generic()
Pingback: buy cheap cialis online()
Pingback: cialis online()
Pingback: tadalafil 20mg()
Pingback: cialis 20mg()
Pingback: tadalafil 20mg()
Pingback: tadalafil generic cialis 20mg()
Pingback: buy generic cialis online()
Pingback: buy cialis()
Pingback: generic cialis tadalafil()
Pingback: buy cialis online()
Pingback: tadalafil 20mg()
Pingback: generic cialis()
Pingback: buy cheap cialis online()
Pingback: generic cialis()
Pingback: generic cialis()
Pingback: cialis online()
Pingback: cialis 20mg()
Pingback: buy generic cialis online()
Pingback: buy cheap cialis online()
Pingback: cialis online()
Pingback: generic viagra()
Pingback: generic viagra sildenafil()
Pingback: generic viagra sildenafil()
Pingback: generic viagra()
Pingback: buy viagra 100mg()
Pingback: generic viagra sildenafil 100mg()
Pingback: viagra 100mg()
Pingback: buy generic viagra online()
Pingback: buy generic viagra()
Pingback: generic viagra 100mg()
Pingback: generic viagra sildenafil 100mg()
Pingback: buy generic viagra online()
Pingback: buy generic viagra sildenafil()
Pingback: buy sildenafil 100mg()
Pingback: sildenafil 100mg()
Pingback: buy generic viagra()
Pingback: buy generic viagra()
Pingback: generic viagra 100mg()
Pingback: generic viagra()
Pingback: buy viagra()
Pingback: viagra 100mg()
Pingback: generic viagra sildenafil()
Pingback: sildenafil 100mg()
Pingback: buy generic viagra online()
Pingback: buy viagra online()
Pingback: sildenafil 100mg()
Pingback: generic viagra()
Pingback: generic viagra sildenafil()
Pingback: generic viagra 100mg()
Pingback: buy sildenafil 100mg()
Pingback: buy generic viagra online()
Pingback: buy generic viagra online()
Pingback: buy viagra()
Pingback: buy generic viagra online()
Pingback: sildenafil 100mg()
Pingback: buy viagra 100mg()
Pingback: generic viagra()
Pingback: buy sildenafil online()
Pingback: generic viagra 100mg()
Pingback: buy generic viagra online()
Pingback: buy viagra online()
Pingback: buy generic viagra sildenafil 100mg()
Pingback: viagra 100mg()
Pingback: buy sildenafil online()
Pingback: buy viagra online()
Pingback: sildenafil 100mg()
Pingback: sildenafil 100mg()
Pingback: buy viagra()
Pingback: viagra 100mg()
Pingback: buy generic viagra online()
Pingback: generic viagra()
Pingback: buy generic viagra sildenafil()
Pingback: viagra 100mg()
Pingback: viagra 100mg()
Pingback: generic viagra sildenafil()
Pingback: buy generic viagra()
Pingback: buy sildenafil online()
Pingback: buy sildenafil online()
Pingback: buy viagra()
Pingback: viagra 100mg()
Pingback: buy generic viagra sildenafil()
Pingback: buy sildenafil online()
Pingback: buy generic viagra()
Pingback: generic viagra sildenafil()
Pingback: generic viagra sildenafil()
Pingback: viagra 100mg()
Pingback: buy generic viagra online()
Pingback: buy sildenafil 100mg()
Pingback: generic viagra sildenafil 100mg()
Pingback: sildenafil 100mg()
Pingback: buy viagra online()
Pingback: buy sildenafil 100mg()
Pingback: viagra 100mg()
Pingback: generic viagra 100mg()
Pingback: generic viagra sildenafil()
Pingback: buy viagra online()
Pingback: buy viagra 100mg()
Pingback: buy viagra 100mg()
Pingback: buy viagra online()
Pingback: viagra 100mg()
Pingback: buy generic viagra sildenafil 100mg()
Pingback: buy sildenafil online()
Pingback: buy generic viagra()
Pingback: sildenafil 100mg()
Pingback: viagra 100mg()
Pingback: generic viagra sildenafil 100mg()
Pingback: buy viagra 100mg()
Pingback: generic viagra 100mg()
Pingback: buy generic viagra sildenafil()
Pingback: generic viagra()
Pingback: buy viagra online()
Pingback: sildenafil 100mg()
Pingback: buy generic viagra online()
Pingback: buy generic viagra sildenafil()
Pingback: buy generic viagra online()
Pingback: buy viagra online()
Pingback: buy generic viagra sildenafil()
Pingback: sildenafil 100mg()
Pingback: sildenafil 100mg()
Pingback: generic viagra 100mg()
Pingback: sildenafil 100mg()
Pingback: generic viagra sildenafil 100mg()
Pingback: sildenafil 100mg()
Pingback: buy generic viagra()
Pingback: buy viagra()
Pingback: buy viagra online()
Pingback: buy generic viagra sildenafil()
Pingback: generic viagra sildenafil()
Pingback: buy viagra 100mg()
Pingback: viagra 100mg()
Pingback: buy generic viagra sildenafil 100mg()
Pingback: buy viagra()
Pingback: sildenafil 100mg()
Pingback: generic viagra sildenafil 100mg()
Pingback: buy viagra()
Pingback: buy generic viagra online()
Pingback: generic viagra 100mg()
Pingback: buy generic viagra online()
Pingback: generic viagra sildenafil 100mg()
Pingback: generic viagra()
Pingback: buy viagra()
Pingback: buy sildenafil 100mg()
Pingback: generic viagra()
Pingback: generic viagra 100mg()
Pingback: generic viagra()
Pingback: viagra 100mg()
Pingback: generic viagra sildenafil 100mg()
Pingback: buy viagra 100mg()
Pingback: generic viagra()
Pingback: buy generic viagra sildenafil()
Pingback: buy sildenafil online()
Pingback: buy viagra 100mg()
Pingback: sildenafil 100mg()
Pingback: buy generic viagra()
Pingback: buy viagra()
Pingback: buy viagra 100mg()
Pingback: buy viagra online()
Pingback: buy viagra 100mg()
Pingback: buy sildenafil online()
Pingback: generic viagra sildenafil()
Pingback: generic viagra sildenafil()
Pingback: buy viagra online()
Pingback: buy levitra online()
Pingback: buy levitra()
Pingback: generic levitra vardenafil()
Pingback: levitra 20mg()
Pingback: vardenafil generic()
Pingback: buy generic levitra online()
Pingback: levitra generic()
Pingback: buy levitra()
Pingback: vardenafil 20mg()
Pingback: buy cheap levitra online()
Pingback: buy cheap levitra online()
Pingback: vardenafil 20mg()
Pingback: buy cheap levitra online()
Pingback: buy generic levitra online()
Pingback: levitra generic()
Pingback: generic levitra vardenafil()
Pingback: buy cheap levitra online()
Pingback: vardenafil 20mg()
Pingback: levitra online()
Pingback: levitra generic()
Pingback: vardenafil generic levitra 20mg()
Pingback: buy cheap levitra online()
Pingback: buy generic levitra online()
Pingback: buy levitra()
Pingback: levitra online()
Pingback: generic levitra vardenafil()
Pingback: buy generic levitra online()
Pingback: vardenafil generic()
Pingback: buy cheap levitra online()
Pingback: generic levitra vardenafil()
Pingback: vardenafil 20mg()
Pingback: buy generic levitra online()
Pingback: vardenafil generic()
Pingback: levitra online()
Pingback: buy levitra()
Pingback: vardenafil 20mg()
Pingback: buy generic levitra online()
Pingback: buy levitra online()
Pingback: buy generic levitra online()
Pingback: vardenafil 20mg()
Pingback: generic levitra()
Pingback: vardenafil 20mg()
Pingback: vardenafil 20mg()
Pingback: levitra online()
Pingback: buy levitra online()
Pingback: levitra online()
Pingback: buy levitra()
Pingback: vardenafil generic levitra 20mg()
Pingback: vardenafil 20mg()
Pingback: generic levitra vardenafil()
Pingback: levitra 20mg()
Pingback: generic levitra()
Pingback: buy levitra online()
Pingback: buy levitra online()
Pingback: buy levitra()
Pingback: generic levitra()
Pingback: buy generic levitra online()
Pingback: levitra 20mg()
Pingback: buy generic levitra online()
Pingback: buy generic levitra online()
Pingback: vardenafil 20mg()
Pingback: buy levitra online()
Pingback: vardenafil 20mg()
Pingback: vardenafil 20mg()
Pingback: buy levitra online()
Pingback: buy levitra()
Pingback: buy levitra()
Pingback: levitra online()
Pingback: levitra 20mg()
Pingback: buy cheap levitra online()
Pingback: buy generic levitra online()
Pingback: vardenafil 20mg()
Pingback: levitra generic()
Pingback: levitra generic()
Pingback: buy levitra()
Pingback: buy levitra online()
Pingback: buy levitra()
Pingback: buy cheap levitra online()
Pingback: buy generic levitra online()
Pingback: buy cheap levitra online()
Pingback: buy levitra online()
Pingback: buy generic levitra online()
Pingback: buy levitra online()
Pingback: buy levitra online()
Pingback: levitra generic()
Pingback: generic levitra()
Pingback: buy cheap levitra online()
Pingback: buy levitra online()
Pingback: generic levitra()
Pingback: buy levitra online()
Pingback: crypto trade bot()
Pingback: crypto trade bot()
Pingback: cryptobot()
Pingback: tradeing bot()
Pingback: crypto trade bot()
Pingback: cryptobot()
Pingback: informática suporte()
Pingback: best executive resume writer()
Pingback: deking()
Pingback: deking()
Pingback: deking()
Pingback: deking()
Pingback: deking()
Pingback: террасная доска()
Pingback: deking()
Pingback: декинг()
Pingback: hookup()
Pingback: hookup()
Pingback: dating()
Pingback: online dating()
Pingback: dating()
Pingback: hookup()
Pingback: dating()
Pingback: dating()
Pingback: hookup()
Pingback: приворот()
Pingback: приворот()
Pingback: заговор()
Pingback: отворот()
Pingback: отворот()
Pingback: приворот()
Pingback: отворот()
Pingback: приворот()
Pingback: заговор()
Pingback: заговор()
Pingback: заговор()
Pingback: приворот()
Pingback: приворот()
Pingback: отворот()
Pingback: заговор()
Pingback: отворот()
Pingback: заговор()
Pingback: заговор()
Pingback: приворот()
Pingback: слоты()
Pingback: казино()
Pingback: казино()
Pingback: слоты()
Pingback: игровые автоматы()
Pingback: игровые автоматы()
Pingback: казино()
Pingback: слоты()
Pingback: казино()
Pingback: слоты()
Pingback: слоты()
Pingback: игровые автоматы()
Pingback: слоты()
Pingback: слоты()
Pingback: слоты()
Pingback: слоты()
Pingback: слоты()
Pingback: казино()
Pingback: слоты()
Pingback: игровые автоматы()
Pingback: казино()
Pingback: слоты()
Pingback: казино()
Pingback: игровые автоматы()
Pingback: игровые автоматы()
Pingback: слоты()
Pingback: казино()
Pingback: binary opciones()
Pingback: binary opciones()
Pingback: trading opciones()
Pingback: binary broker()
Pingback: binary opciones()
Pingback: binary broker()
Pingback: binary opciones()
Pingback: binary opciones()
Pingback: trading opciones()
Pingback: binary opciones()
Pingback: trading opciones()
Pingback: trading opciones()
Pingback: trading opciones()
Pingback: binary opciones()
Pingback: binary broker()
Pingback: trade program()
Pingback: cryptobot()
Pingback: cryptobot()
Pingback: cryptobot()
Pingback: tradebot()
Pingback: cryptobot()
Pingback: tradebot()
Pingback: trade program()
Pingback: cryptobot()
Pingback: tradebot()
Pingback: tradebot()
Pingback: tradebot()
Pingback: tradebot()
Pingback: tradebot()
Pingback: cryptobot()
Pingback: tradebot()
Pingback: trade program()
Pingback: tradebot()
Pingback: cryptobot()
Pingback: tradebot()
Pingback: cryptobot()
Pingback: tradebot()
Pingback: cryptobot()
Pingback: trade program()
Pingback: canadianpharmacystorm.com()
Pingback: genericvgrmax.com()
Pingback: viagrawithoutdoctorspres.com()
Pingback: canpharmb3.com()