


Warren Buffett Continues to Find Value in a Flat Market
It looks like the S&P 500 will finish flat for the 2015 calendar year. The oil glut and The Fed’s decision on interest rates, has kept market returns for the year near zero. It hasn’t been easy for the retail investor to make money in the markets this year. Where is the value? Market valuations are high, earnings continue to grow and Warren Buffet is down 11 percent on the year.
Well, value investing and fundamental analysis were fun while they lasted but it is time to jump ship and take our cash to the track, catch a flier with VRX, or play fantasy football to earn any kind of return. Obviously this is sarcasm. The intelligent investor should remind themselves in times like these to be still and revisit Graham and Doddsville.
As I mentioned, Warren Buffet’s portfolio is down 11 percent on the year. One of his holdings that is of particular interest to the financial media is IBM. Berkshire Hathaway announced that they have experienced a $2 billion loss on their IBM investment. What does Buffett do? He took a visit to Graham and Doddsville. He doubled down on IBM.
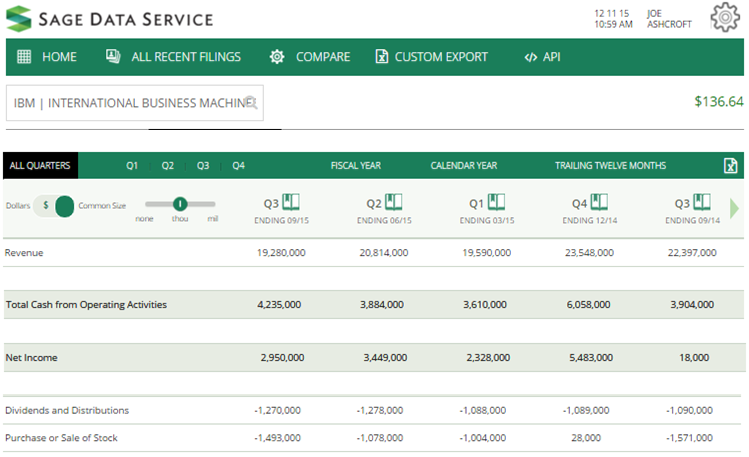
At a P/E ratio of less than 10, IBM is currently on sale. It is true that IBM’s earnings have been declining over the past 14 quarters. Basing investing decisions on earnings alone is foolish. By taking a closer look at their fundamentals, the company is still profitable and generating a significant amount of cash from operations. IBM has also continued to pay dividends and buy back shares in the midst of declining earnings. Increasing the proportion of earnings that are paid back to shareholders is a good sign for investors and Buffet knows this.
So in the end it might turn out that Warren Buffett knows what he is doing after all. Do not fear intelligent investors, be still and remember your teachings. Your leader is still on his game and continues to practice the same techniques that have allowed him to experience such incredible success. Opportunities are still out there. If we base investing decisions on earnings alone these opportunities will be missed. Will IBM’s earnings begin to increase? No one knows for sure. If investing involved easy decisions everyone would be wealthy. To increase the probability of success, fundamental analysis, strong character, and confidence is required. Mr. Buffett knows this and he has a pretty good track record, right?
[Disclosure: The author of this post holds a position in the stock discussed in this article]
Pingback: Trisha()
Pingback: venus factor()
Pingback: Looking for new music, go here()
Pingback: tania de saram()
Pingback: tania marie de saram()
Pingback: charity fraudster()
Pingback: Best Newspaper in India()
Pingback: para kazanmak()
Pingback: economics tuition()
Pingback: rhodium()
Pingback: rhodium()
Pingback: dryer vent cleaners()
Pingback: Sandra balan()
Pingback: computer kopen Aalten()
Pingback: in vitro()
Pingback: en blog om mode()
Pingback: sexleksaker outlet()
Pingback: dang ky m88 tren dien thoai()
Pingback: M88()
Pingback: economics tuition()
Pingback: cul()
Pingback: http://britlock.com.au()
Pingback: click here to hire an attorney()
Pingback: louise parker personal training review()
Pingback: http://www.godwinsremovals.co.uk/international-removals/northern-ireland()
Pingback: download free()
Pingback: drive with uber()
Pingback: Skrota bilen Göteborg()
Pingback: peptide ghrp 6 side effects()
Pingback: Skrota bilen()
Pingback: trumpforchildren()
Pingback: masonry()
Pingback: http://www.juegosfriv.one/()
Pingback: dumbell curl()
Pingback: Overzicht Loterijen()
Pingback: localtvsolutions.com/fort-stockton-tx-tv-mounting-79735-tv-repair/()
Pingback: •HAUL•ÒÐÅÍÄÛ()
Pingback: hernia mesh lawsuit()
Pingback: http://worldhealthone.com()
Pingback: Tech CEO()
Pingback: link()
Pingback: vitamin supplements, mineral supplements, best vitamins, best supplements()
Pingback: wallstreet forex 2.0, forex robot, forex trading robot, best forex software, forex software, forex trading software, trading software()
Pingback: youtube abonnenten kaufen()
Pingback: hampton bay ceiling fan replacement parts()
Pingback: Autoapprove SEO Backlinks()
Pingback: play subway surfers()
Pingback: UK Dog News()
Pingback: Online Brand Management()
Pingback: ruszta betonowe()